
Flow Cytometry Software, Reimagined
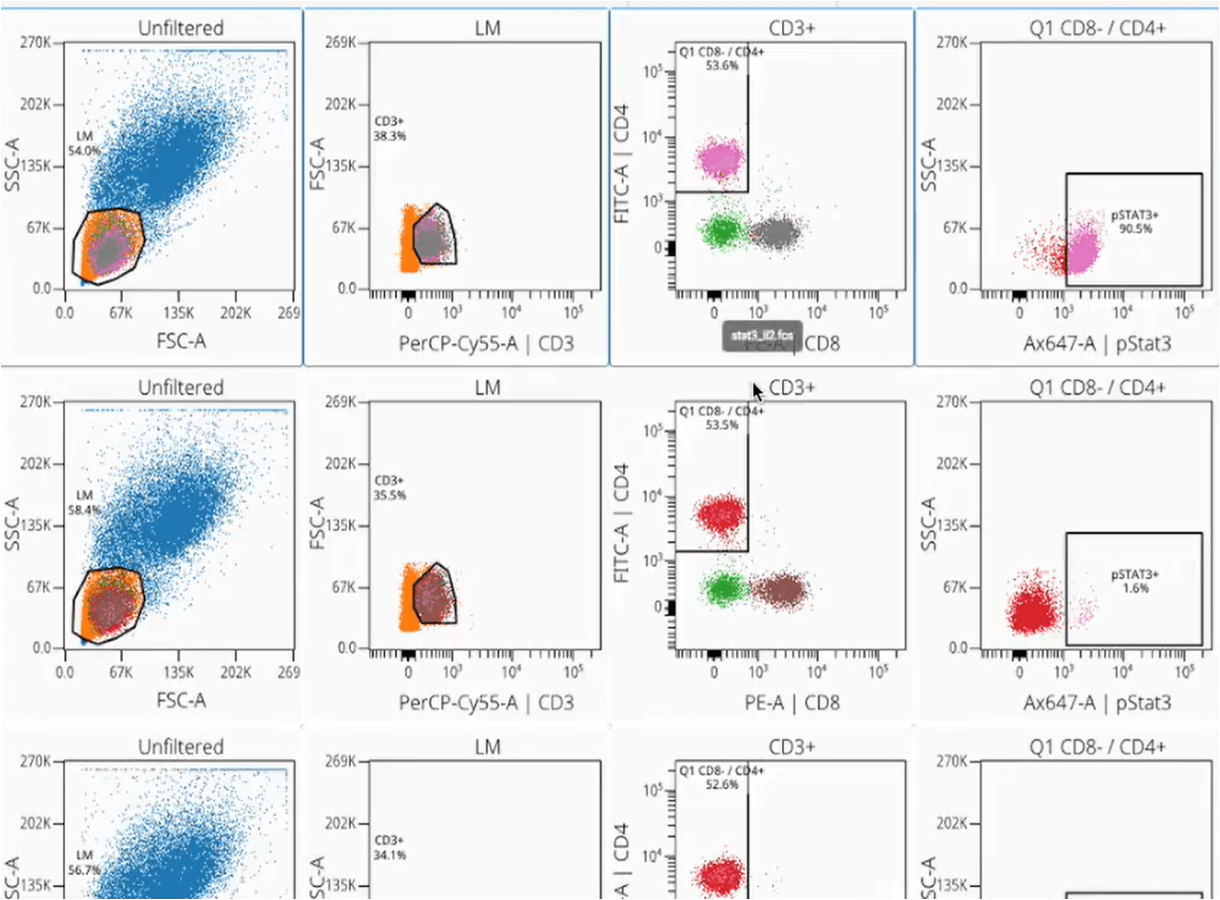
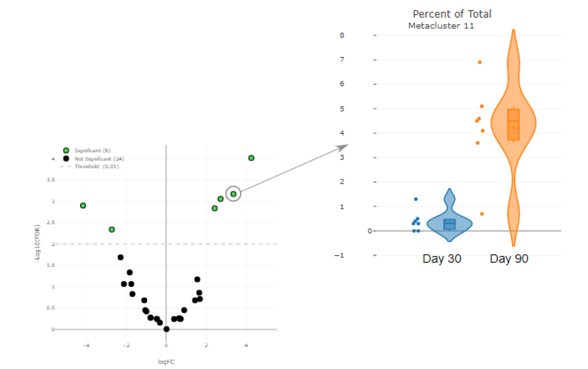
OMIQ is a modern cytometry analysis platform bridging machine learning and analytical pipelines with classical manual analysis.
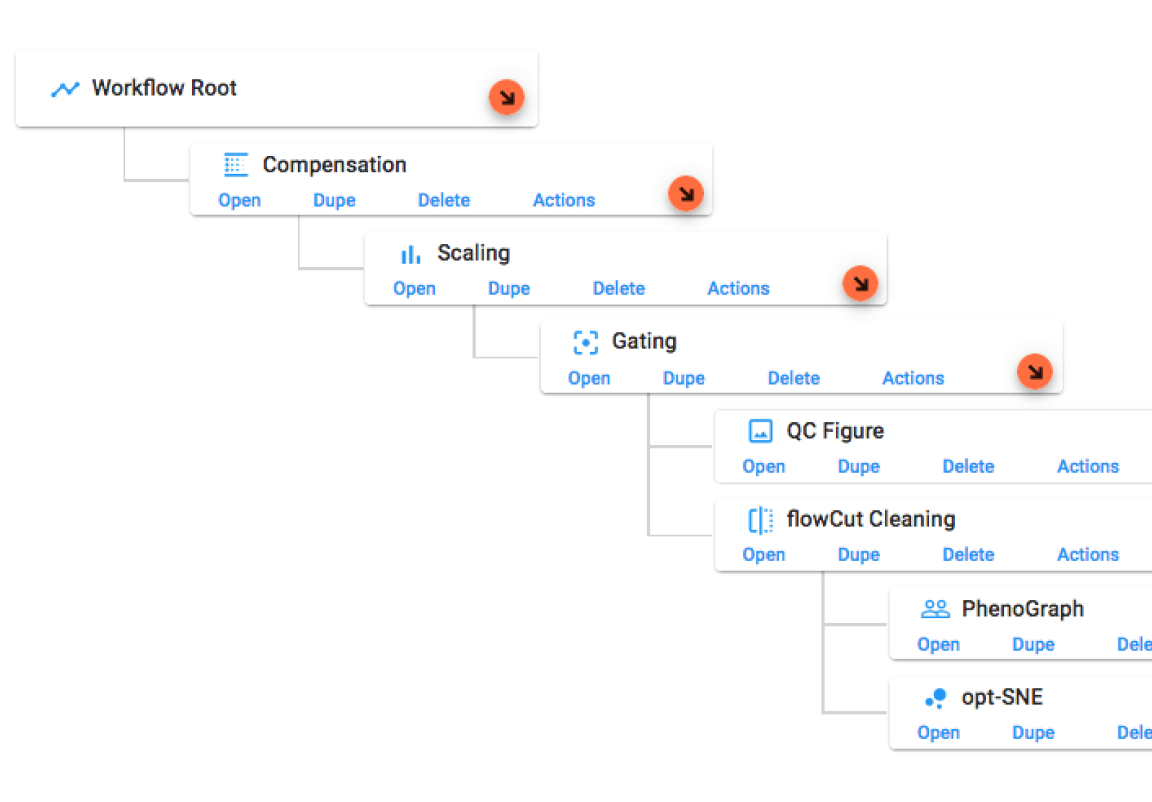
How OMIQ Works
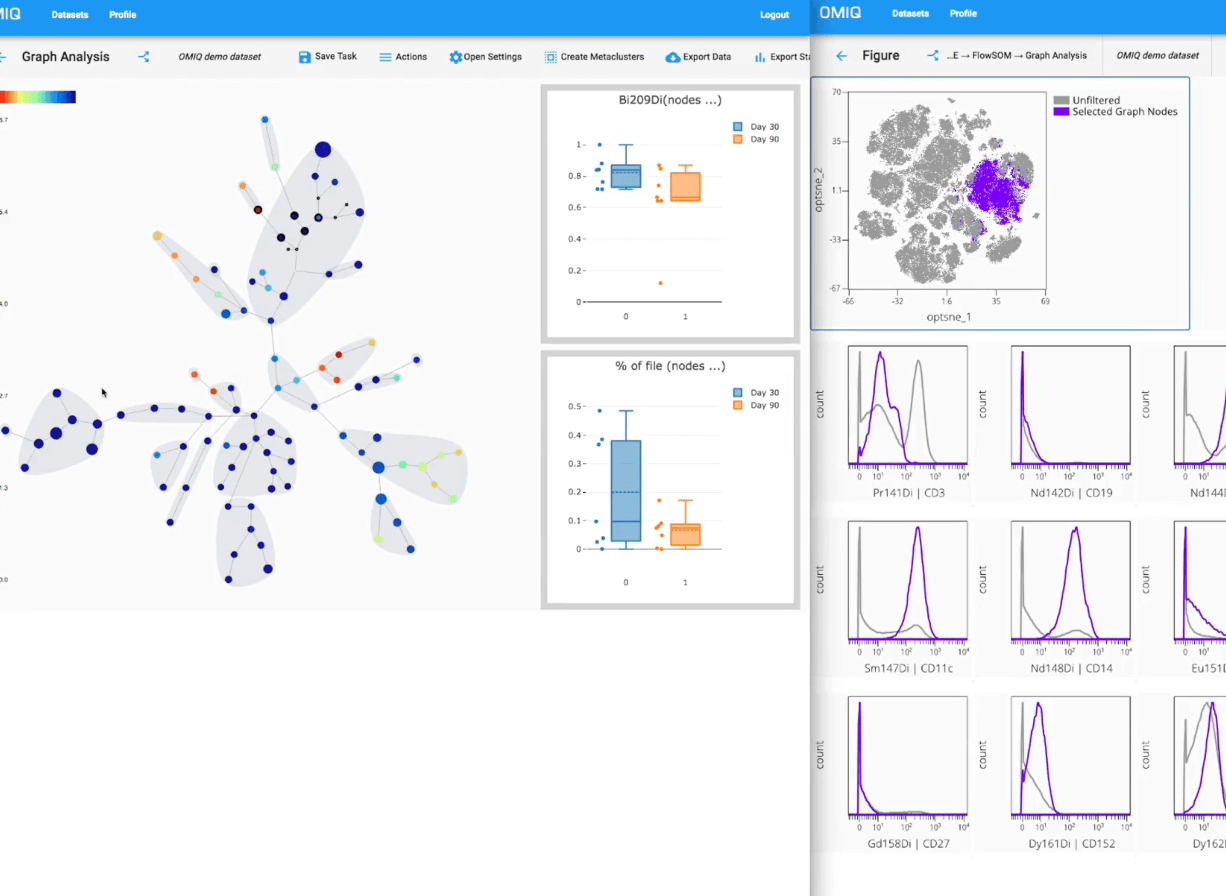
Combining high-performance analytical power and modern user-focused design
Trusted by the world’s leading research
organizations


Experience the future of flow cytometry.